You see this big ol’ graph right here.
It doesn’t look great.
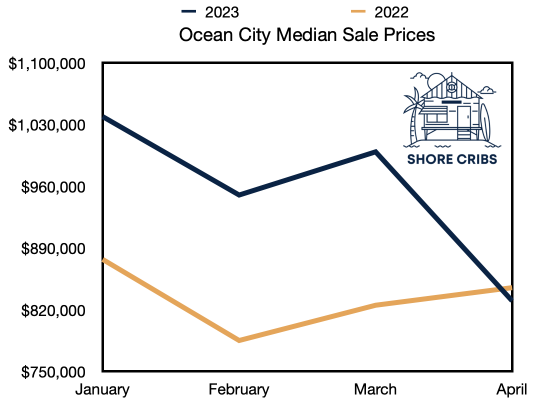
After pretty much constant year-over-year growth since the start of the pandemic, YoY median sales price decreased in Ocean City in April.
But there is more to the story. Let’s dig in like we’re pile-driving a giant windmill into the ocean floor, only with less dead whales.
Like this? Subscribe to our free weekly Ocean City real estate newsletter:
Nationwide Real Estate Prices Down Sharply
April housing data was released earlier this week, and it contained two pretty headline-grabbing figures:
- national median sale prices were down 1.2% YoY– the largest drop since – checks notes, squints, wonders what the hell? – January, 2012
- sales volume was down – checks notes, squints, get out an abacus and then wonders what the hell an abacus is – 23.2% YoY
It’s been well-publicized that mortgage rates over 6% are incentivizing many would-be sellers to stay put. Their appreciation in equity may well be offset by a jump from a mortgage rate at 3%-4% to over 6% at their new property.
Meanwhile, on the buy side, many are waiting to see if rates pull back if and when the FED pauses hikes or cuts rates.
That’s how you get sagging sale prices and a dramatic downturn in already-low sales volume.
Ocean City’s Dip May Be a Blip
Hey, that rhymed!
Anyway, as we wrote in our Walking The Boards Ocean City newsletter last week, here are the median sale prices for the last four full months in Ocean City:
January: $1,039,000
February: $950,000
March: $999,000
April: $830,000
Now, here’s the median sale price for 54 sales so far in May:
May: $979,000
The average in May is a whopping $1.2 million, led by this bad boy selling for $6.45 million.
So May, at least so far, seems to be back within its normal trading range for 2023.
Bubble Time?
Still, you have to wonder at what point things turn.
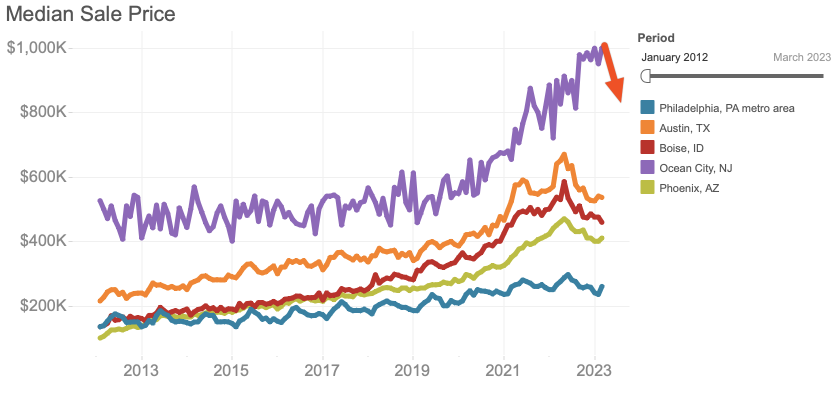
This is a snapshot of a handful of pandemic bubble towns, like Boise, Phoenix, and Austin, along with the relatively stable Philly metro market, compared to Ocean City. Redfin’s data doesn’t include April yet, so I drew a line where Ocean City’s April data would have fallen.
What do you notice about this?
Few things:
- The pandemic bubble towns all declined quickly in the middle of last year
- Philly’s market is remarkably stable
- Ocean City just kept going
The price per square foot chart – always higher in a beach town – is even more striking:
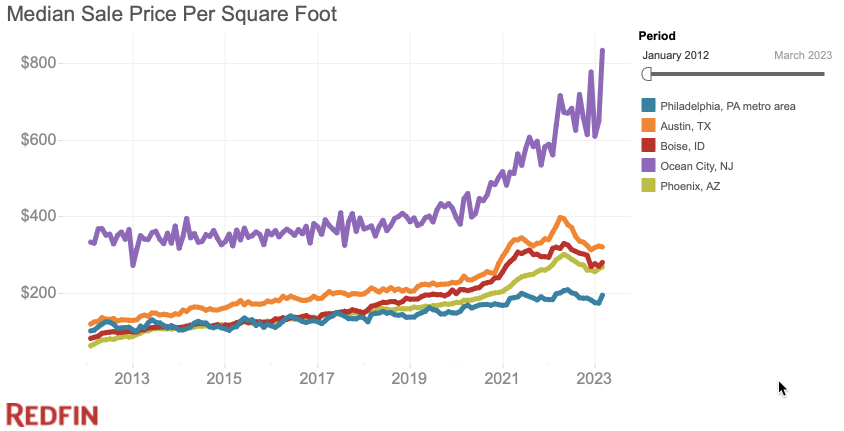
Prices have effectively doubled in Ocean City in four years. That’s largely what happened in those bubble markets until they turned.
The Jersey Shore in general is a great work-from-home location. Unlike those markets, which largely required you to move there, the Shore allows you to keep your home in the city and spend just part of your time at the beach. This is why Cape May County is the most expensive second home market in the country, which we told you about earlier this week.
But as much as we love Ocean City, something has to give here. Eventually things have to slow down. April looked to be a turning point, but May has rebounded.
So here’s the question: If interest rates remain flat, say between 6% and 6.5%, does the lower inventory keep prices stable (or going up)? And then what happens when rates come down? Does all the pent up listing demand tank the market? Does it bring in even more buyers looking for second homes? It’s hard to tell. But I suspect something has to snap hard if we see a rapid change in rates.
Like this? Subscribe to our free weekly Ocean City real estate newsletter:
