Hello! Welcome to the second-ever Shore Cribs newsletter— everything you need to know about real estate in Ocean City, New Jersey.
Like this? Subscribe to our free weekly Ocean City real estate newsletter:
This week, we have our May Market Report. National sites like Zillow and Redfin compile previous month data towards the end of the following month, and they do so with a generic view and no market-specific commentary. We’re better than that around here.
May Market Report
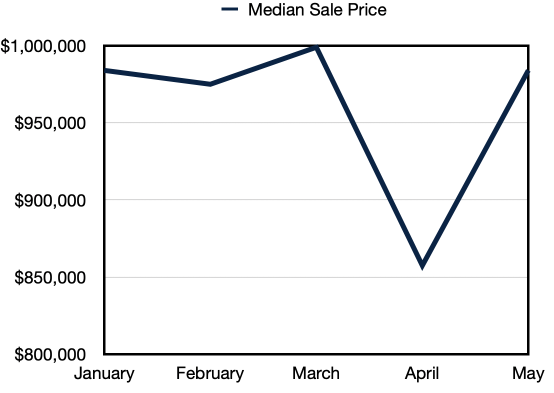
First up, median sales price returned to its 2023 flight level in May at $984,000, up 9% over May of 2022.
The data, please:
January: $983,999
February: $975,000
March: $999,000
April: $857,000
May: $984,000
One of these things isn’t like the other— and that’s April, which dipped down into the mid-800s.
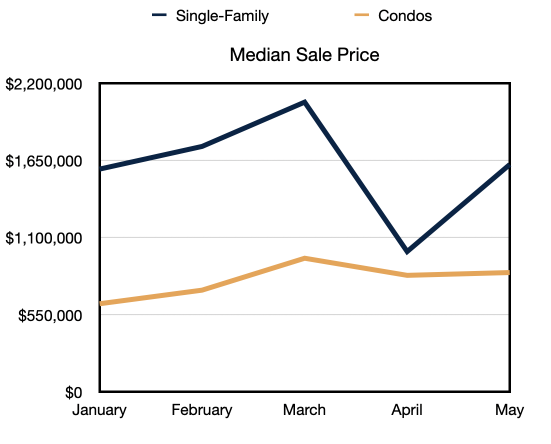
Interestingly, single-family prices, which led the way through much of the last three years, have sagged a bit the last two months and are the reason for the slight decline, while condo prices have held steady-ish:
Despite mild softening in single-family prices, you can see just how high we’re flying when you zoom out and compare median sales price from January-May over the last six years:
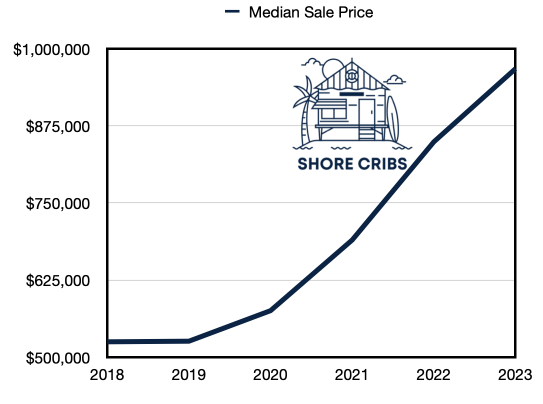
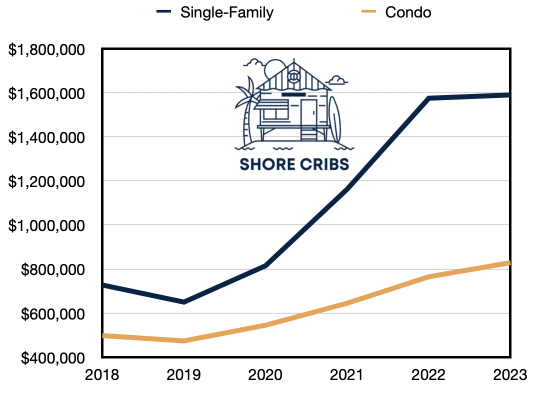
Median sales price in Ocean City has nearly doubled since 2018(!), with single-family homes more than doubling:
OK, so all good right? April was just an anomaly?! We’re still at record levels and 100% investment appreciation in six years! A 3-BEDROOM CONDO IS WORTH OVER $800K PRAISE THE LORD JESUS!
Right?
Right?!?!?!
Maybe.
I’d like to call your attention to DOM.
No, not the Italian Christmas Donkey.
I’m talking about his less festive cousin days on market— the median number of days a residential property is active on the real estate market. Way less fun at parties, but a great barometer of market hysteria.
DOM in May of 2022 was a svelte 10 days.
But this May DOM ballooned to 29 days.
That means the number of days to sell a house in Ocean City nearly tripled in the last 12 months.
It can be a sign of slowing demand.
But then why are prices still so high and up 9% YoY if there’s less demand?
Because inventory is still shockingly low.
There were 105 new residential listings to hit the market in May and 523 new listings so far this year.
Here’s how that compares to January-May over the last six years:
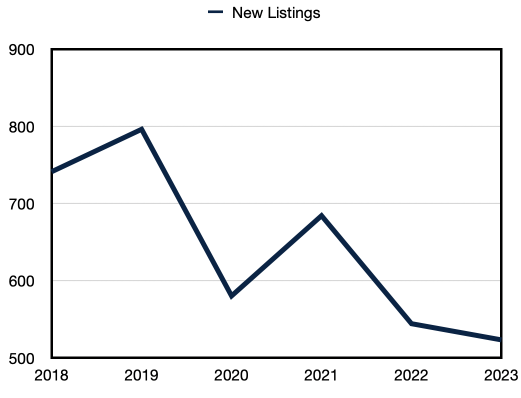
Not a lot, Bob!
Now, I’m not skilled enough with Excel or Numbers to put this on one chart, but here’s what it looks like when I overlay the median sales price over the last six years with the number of new listings to hit the market over that same time period— the lines go in opposite directions:

That’s hideous, I know. It’s the Marla Hooch of real estate charts…

… but bear with me.
There are a lot of factors driving the macro real estate market since the pandemic. Wild mortgage rate swings, lack of inventory, relocation, work from home, free money floating around, bank crises, and so much more have all played a supporting role. But, unsurprisingly, prices are largely inversely correlated with inventory and new listings. As new homes available have shrunk to all-time lows, prices have soared to all-time highs in Ocean City.
Makes sense.
The current lack of inventory nationwide can largely be attributed to rapidly rising interest rates over the last 18 months forcing would-be sellers to stay put lest they give up their 4% mortgage.
Usually interest rate increases would also impact demand. But demand in Ocean City and for second homes in Cape May County as a whole has remained extremely high. Work-from-home and hybrid work is allowing more Philly metro area folks to spend more time at the Shore. The Inquirer had an article about this last month. And since these are islands— “they are not making any more land,” as billionaire investor Ken Griffin told the Philly Business Journal about Stone Harbor.
So even as interest rates have spiked, demand for quality Shore real estate has remained strong.
Remember we told you about DOM growing to 29 in May? Yeah, that’s up from last May, but it’s still very low:

DOM may be putting some weight back on, but he was downright anorexic in 2021 and 2022. Like Christian Bale in The Machinist:

So all of this explains why despite some softening in demand, there remains more than enough to keep prices high since there is so little inventory.
What changes that?
This is where things get interesting.
What happens if and when interest rates come down, perhaps later this year? You are almost certain to see an uptick in new listings as sellers feel safer leaving their 4% mortgage behind for, maybe, a 5% mortgage in an upgrade.
Sure, lower interest rates may also bring more buyers into the market. But demand has its limits. Will the higher demand offset a flood of new listings? Timing could matter, as sellers are more likely to list in the fall or early winter than summer.
Right now, there are only 238 active residential listings in Ocean City. Our on-staff local agent says that number should typically be between 600-900.
So we could double or triple available inventory and still be considered “normal”. At that point, you would expect DOMto revert closer to its 50-60 mean (think ripped Christian Bale in Batman). And that’s how, maybe, you get the market to give back some of its gains the way so many other pandemic boom towns have.
Or maybe prices keep ripping higher.

Like this? Subscribe to our free weekly Ocean City real estate newsletter:
